Tracing all SQL generated by Entity Framework
March 03, 2013
A nice quick one this week. I spent a little bit of time trying to debug some Entity Framework queries, particularly the parameter values used in a SQL INSERT composed when calling AddObject/SaveChanges. There are a few ways to determine the underlying SQL.
If you are only interested in LINQ queries, using ToTraceString() on ObjectQuery is a good choice
Entity Framework provides a way to get the underlying SQL for SELECT queries. To do so, you need to cast the query (of type IQueryable) to an ObjectQuery and call ToTraceString() on it. I usually pipe this into Debug.Writeline so it appears in the Output Window of Visual Studio if you attach a debugger to the running .NET application.
So, in a particularly contrived example, lets say we have a model mapped in the classic database-first style, and want to debug a query over all people.
Here’s a full example with comments:
var query = (from person in ctx.People select person);//query is of type IQueryablestring sql = ((ObjectQuery) query).ToTraceString();//writes to output windowDebug.WriteLine(sql);
So this is great, but what we can’t do with this mechanism is write out any INSERTs, if we wanted to debug the addition of a new person into People for example.
Tracing INSERTs, UPDATEs and DELETEs in EF requires a little more work
Here you’ve got a couple of options:
Community Entity Framework Provider Wrappers
The Community Entity Framework Provider Wrappers let you enable tracing by creating a derived data context from your original Entity Framework context. This does require some (albeit temporary) code changes during debugging, explained on the link above.
Making good ol’ SQL Profiler work for you
You can also make use of SQL Profiler, great when you need to debug something but aren’t prepared (or are unable) to make code changes.
Out of the box it’s not geared up for tracing out Entity Framework style querying, but I found these tips really useful to get started. When you are in the Trace Properties dialog:
Select the right RPC events
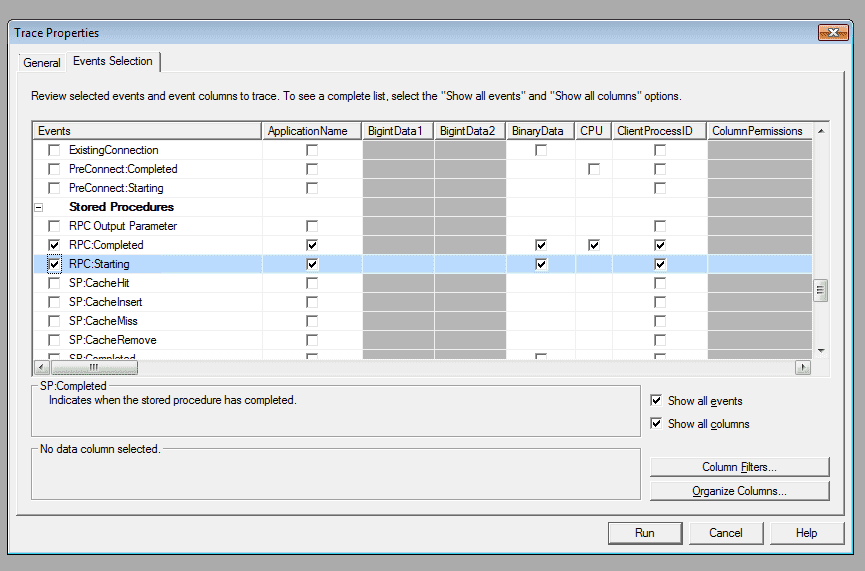
In Events Selection, untick all the default events, then tick ‘Show All Events’ and ‘Show All Columns’ and go down to the Stored Procedures events list. Tick RPC:Completed and RPC:Starting, as the screenshot below shows:
Now, before you click Run…
Filter further…
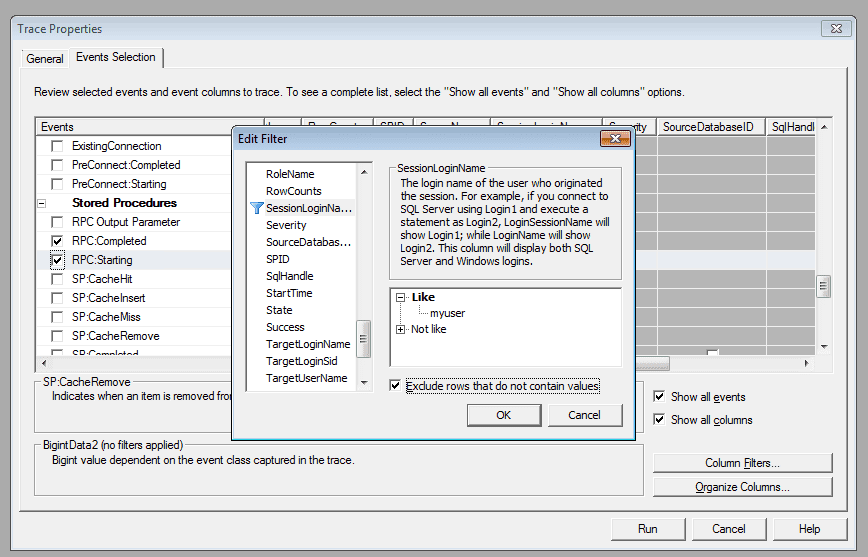
I found filtering by SessionLoginName ONLY to the username your app connects to the SQL database by in the connection string filtered out any extraneous events to those I was really interested in.
Click ‘Column Filters’ and scroll down to the SessionLoginName column, expand the ‘Like’ tree and enter the user in the connection string used by the web application. Additionally, tick ‘Exclude rows that do not contain values’.
Now you can click ‘Run…’ to collect your EF queries regardless of their type.

